
Stratégie · 8 min read
BIM deployment dashboard: the indicators to track
By Mickael Quinart · 9 October 2026
Time spent, rework, clashes, skills, client satisfaction: a simple dashboard to steer BIM deployment and prove its ROI.
Hello everyone, Mickael Quinart, BIM/CAD Consultant at PALLADION. Today, we're going to delve into a crucial topic for any successful BIM deployment: performance measurement. As I often say, "What isn't measured doesn't improve."
What isn't measured doesn't improve
Without concrete and measurable indicators, BIM implementation often remains confined to subjective impressions: "we're wasting time," or conversely, "it's better than before." These feelings, while understandable, are not sufficient to steer a business strategy. An objective dashboard, built on reliable data, is essential for several fundamental reasons: it enables the proactive management of the approach, reassures management about the investments made, and ultimately demonstrates the Return on Investment (ROI) of BIM.
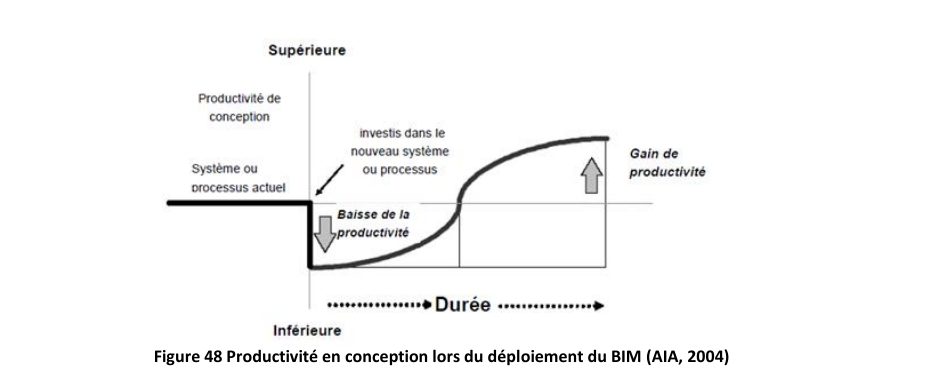
This curve, from an AIA study dating back to 2004, perfectly illustrates this phenomenon: an initial investment in time and resources (the drop in productivity) is necessary to reach a higher productivity plateau in the long term. Measurement ensures that this trajectory of progress is being followed.
Recommended Indicators
To build this dashboard, it's essential to choose relevant indicators that cover the different facets of BIM's impact. Here is a selection of key indicators, categorised by family, with their recommended monitoring frequency:
| Family | Indicator | Frequency |
|---|---|---|
| Productivity | Hours per phase vs comparable CAD project | End of phase |
| Quality | Number of drawing revisions after distribution | Monthly |
| Coordination | Open/resolved clashes, average resolution time | Per review |
| Construction Site | Non-conformance reports related to design | Monthly |
| Skills | Average level on skills matrix per role | Bi-annually |
| Maturity | BIMetric self-assessment score | Annually |
| Commercial | Proportion of turnover from BIM services | Annually |
Reading the Learning Curve
It is imperative to understand that the first projects undertaken with BIM will, in most cases, reveal an apparent drop in productivity. This phase is not only expected but also entirely normal. It reflects the efforts of learning, adapting to new tools (like Revit or Archicad), new working methods, and implementing new collaboration procedures.
The crucial indicator to monitor is not instantaneous performance, but the trend observed over several successive projects. The ability to progressively reduce this initial drop in productivity, and then transform it into a consistent long-term gain, is the true sign of success. The most significant benefits of BIM often materialise beyond the initial design phase, notably through a drastic reduction in rework during the execution (EXE) phase and on the construction site. This is where the true return on investment of BIM lies.
Building the Dashboard
Implementing an effective dashboard should not become an administrative burden. The objective is to collect relevant data without overcomplicating existing production processes.
- Choose a maximum of five to seven indicators. Simplicity is key. Too many indicators dilute focus and make monitoring complex. Concentrate on metrics that best reflect your strategic BIM objectives.
- Define a baseline (comparable CAD project). For indicators to be meaningful, they must be compared. A historical reference (a similar project completed using traditional CAD methods) or industry averages, if available, are essential for evaluating progress.
- Collect data without burdening production. Ideally, data comes from existing exports from your tools (analytical accounting software for hours, coordination platforms for clash reports such as Navisworks or Solibri, project management tools). Timesheets are a valuable source for productivity. The key is automation or semi-automation of data collection wherever possible.
- Present the dashboard to the BIM committee and decide on actions. The dashboard is not an end in itself, but a decision-making tool. Its results should be discussed regularly (monthly or quarterly) with key stakeholders (management, project managers, BIM Managers) to identify weaknesses, celebrate successes, and define corrective or improvement actions.
Practical Case Study in a Design Office
Let's imagine a medium-sized structural engineering firm wishing to assess the impact of its transition to BIM on its residential building projects.
The firm selected the following indicators:
- Productivity: Total hours spent on the structural design phase (Preliminary Design/Detailed Design/Construction Documents/Execution) compared to a traditional project of the same scope.
- Quality: Number of Requests for Information (RFIs) from the construction site regarding structural inconsistencies with other trades.
- Coordination: Number of non-conformities or serious clashes detected during inter-trade model reviews, as well as the average resolution time.
- Skills: Evolution of proficiency levels in BIM software (Revit Structure) among drafters and engineers.
On the initial BIM projects, the productivity indicator showed a 15% increase in time spent in the design phase compared to baseline CAD projects. This data, if read in isolation, could be alarming. However, the BIM committee, aware of the learning curve, also analysed:
- The number of RFIs from the construction site, which decreased by 30% compared to CAD projects.
- The number of serious clashes resolved during the design phase, which doubled, thus avoiding costly corrections on site.
- The positive evolution of team skills, attested by self-assessments and internal training.
By cross-referencing this information, the design office can see that, despite an initial time investment, BIM significantly de-risks the construction phase and improves the quality of deliverables. Decided actions include implementing more robust project templates to standardise repetitive tasks, advanced training on parametric modelling, and integrating clash detection (via tools like Navisworks or Solibri) earlier in the design process. This monitoring allows for strategy adjustment and ensures that overall productivity gradually improves on subsequent projects.
Best Practices / Common Mistakes
| Best Practices | Common Mistakes |
|---|---|
| Define clear objectives for each indicator. | Setting unrealistic or absent objectives. |
| Involve teams in the selection and monitoring of indicators. | Imposing a dashboard without consultation or explanation. |
| Automate data collection as much as possible. | Manually collecting complex and time-consuming data. |
| Communicate regularly on results and actions. | Not sharing results or leaving them without follow-up. |
| Adapt indicators according to BIM maturity. | Keeping the same indicators without evolving with needs. |
| Focus on the trend rather than an isolated point. | Panicking or getting overly enthusiastic about a single one-off measurement. |
| Link indicators to business objectives of the company. | Choosing indicators disconnected from strategic challenges. |
Step-by-Step Method for Implementing a BIM Dashboard
To embark on measuring your BIM performance, here is a structured approach in several steps:
- Define the BIM Vision and Objectives: Before measuring, know what you want to achieve. Is it a reduction in errors, improved collaboration, increased productivity, or the acquisition of new skills? These objectives will guide your choice of indicators.
- Select Key Performance Indicators (KPIs): Drawing inspiration from recommendations and your objectives, choose 5 to 7 indicators that you deem most relevant. Ensure they are SMART (Specific, Measurable, Achievable, Relevant, Time-bound).
- Establish Baselines: For each indicator, determine what your "pre-BIM" or "target" will be. This could be historical data from CAD projects, industry benchmarks, or ambitious but achievable goals.
- Implement the Collection Process: Identify data sources (scheduling software, ISO 19650 compliant collaborative CDE platforms like BIM Cloud servers, clash detection tools, timesheets). Formalise who is responsible for collection, how, and at what frequency. Consider using interoperable formats like IFC or BCF to facilitate the exchange and analysis of coordination information.
- Build and Present the Dashboard: Use a simple tool (Excel spreadsheet, Power BI) to visualise your data clearly. Integrate graphs to show trends. Present this dashboard regularly to a BIM steering committee to discuss results and make strategic decisions.
Points of Vigilance
While highly beneficial, implementing a BIM dashboard requires particular attention to several aspects to ensure its relevance and effectiveness.
- Do not neglect training: Teams must understand why these data are collected and how they contribute to continuous improvement. A poor understanding can lead to resistance or the collection of poor-quality data.
- Data quality: "Garbage in, garbage out." Ensure that the data collected is reliable and accurate. Standardisation of work methods and templates in tools like Revit is essential.
- Interpretation of results: A number alone says nothing. It must be put into perspective with the project context, the team's maturity level, and defined objectives. A drop in productivity on a first BIM project can be a positive data point if it is accompanied by a significant reduction in errors during the construction phase.
- Constant evolution: BIM is an evolving process. Your indicators will need to adapt as your BIM maturity progresses and your objectives change. Maturity indicators (like the BIMetric score mentioned) are useful for tracking this overall progression, in line with the requirements of ISO 19650 which guides the exchange of structured information.
- Tools and interoperability: If you use different software (Revit for modelling, Navisworks for coordination, solutions for the CDE), ensure that information can be exchanged efficiently, ideally via open formats like IFC for models and BCF (BIM Collaboration Format) for coordination issues. This greatly facilitates data collection for your indicators.
Key Takeaways
- Few, well-chosen indicators, regularly monitored. This is key to maintaining engagement and effectiveness.
- Compare to a CAD baseline and read the trend. Progress is more important than instantaneous performance.
- Gains are primarily measured in rework and on site. This is where BIM truly reveals its value and ensures ROI.
As a consultant, my role is to support you in this process. Measurement is a fundamental pillar for turning BIM efforts into lasting success. Please do not hesitate if you have any questions or wish to delve deeper into a point.
Article based on the professional thesis "BIM transition and optimised deployment, applied in an engineering firm".
Mickael Quinart, PALLADION
Want to go further?